Version: 9.4.5.v20170502
 Version: 9.4.5.v20170502 |
private support for your internal/customer projects ... custom extensions and distributions ... versioned snapshots for indefinite support ... scalability guidance for your apps and Ajax/Comet projects ... development services for sponsored feature development
JConsole and the Java Mission Control (JMX) are graphical tools; they allow you to remotely manage and monitor your server and web application status using JMX. When following the instructions given below, please also ensure that you make any necessary changes to any anti-virus software you may be using which may prevent JConsole or JMC from running.
The simplest way to enable support is to add the JMX-Remote support module to your {$jetty.base}.
[mybase]$ java /opt/jetty-dist/start.jar --add-to-start=jmx-remote, jmx
INFO: jmx-remote      initialised in ${jetty.base}/start.ini
INFO: jmx             initialised in ${jetty.base}/start.ini
Then open the {$jetty.base}/start.ini (or {$jetty.base}/start.d/jmx-remote.ini) file and edit the properties to suit your needs:
#
# Initialize module jmx-remote
#
--module=jmx-remote
## JMX Configuration
## Enable for an open port accessible by remote machines
jetty.jmxrmihost=localhost
jetty.jmxrmiport=1099
To monitor Jetty’s server status with JConsole, start Jetty and then start JConsole by typing jconsole on the command line.
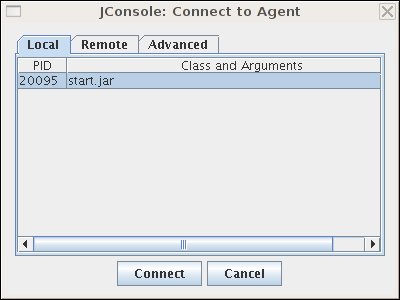
After you start Jetty, you will see a dialog box in JConsole with a list of running processes to which you can connect. It should look something like so:
Important
If you don’t see your Jetty process in the list of processes you can connect to, quickly switch tabs, or close and reopen a new "New Connection" dialog window. This forces JConsole to refresh the list, and recognize your newly-started Jetty process.
Select the start.jar entry and click the "Connect" button. A new JConsole window opens:
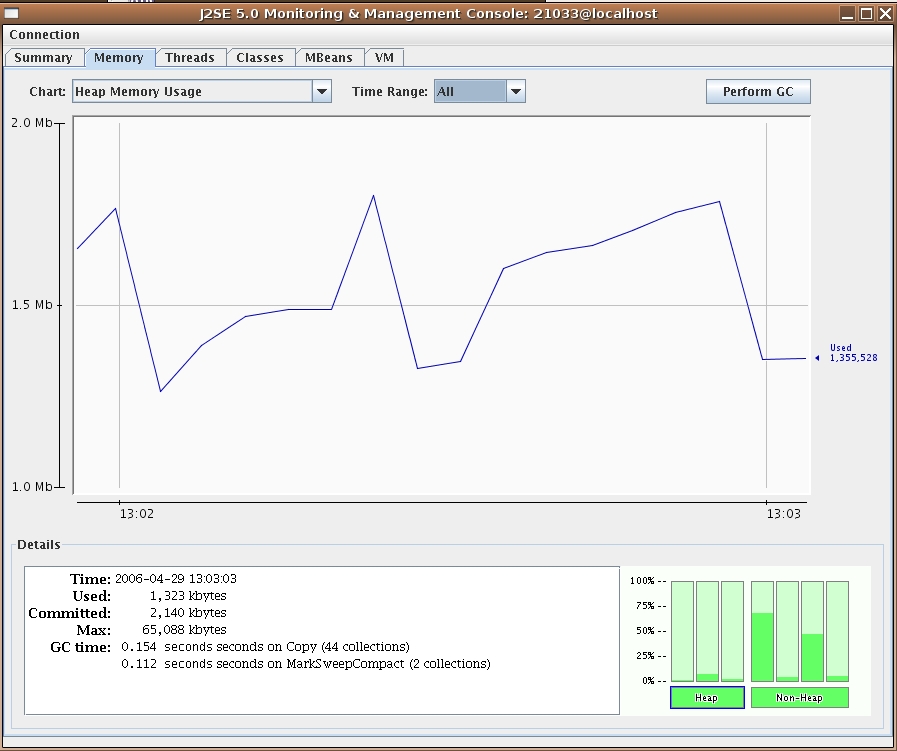
From this window you can monitor memory usage, thread usage, classloading and VM statistics. You can also perform operations such as a manual garbage collect. JConsole is an extremely powerful and useful tool.
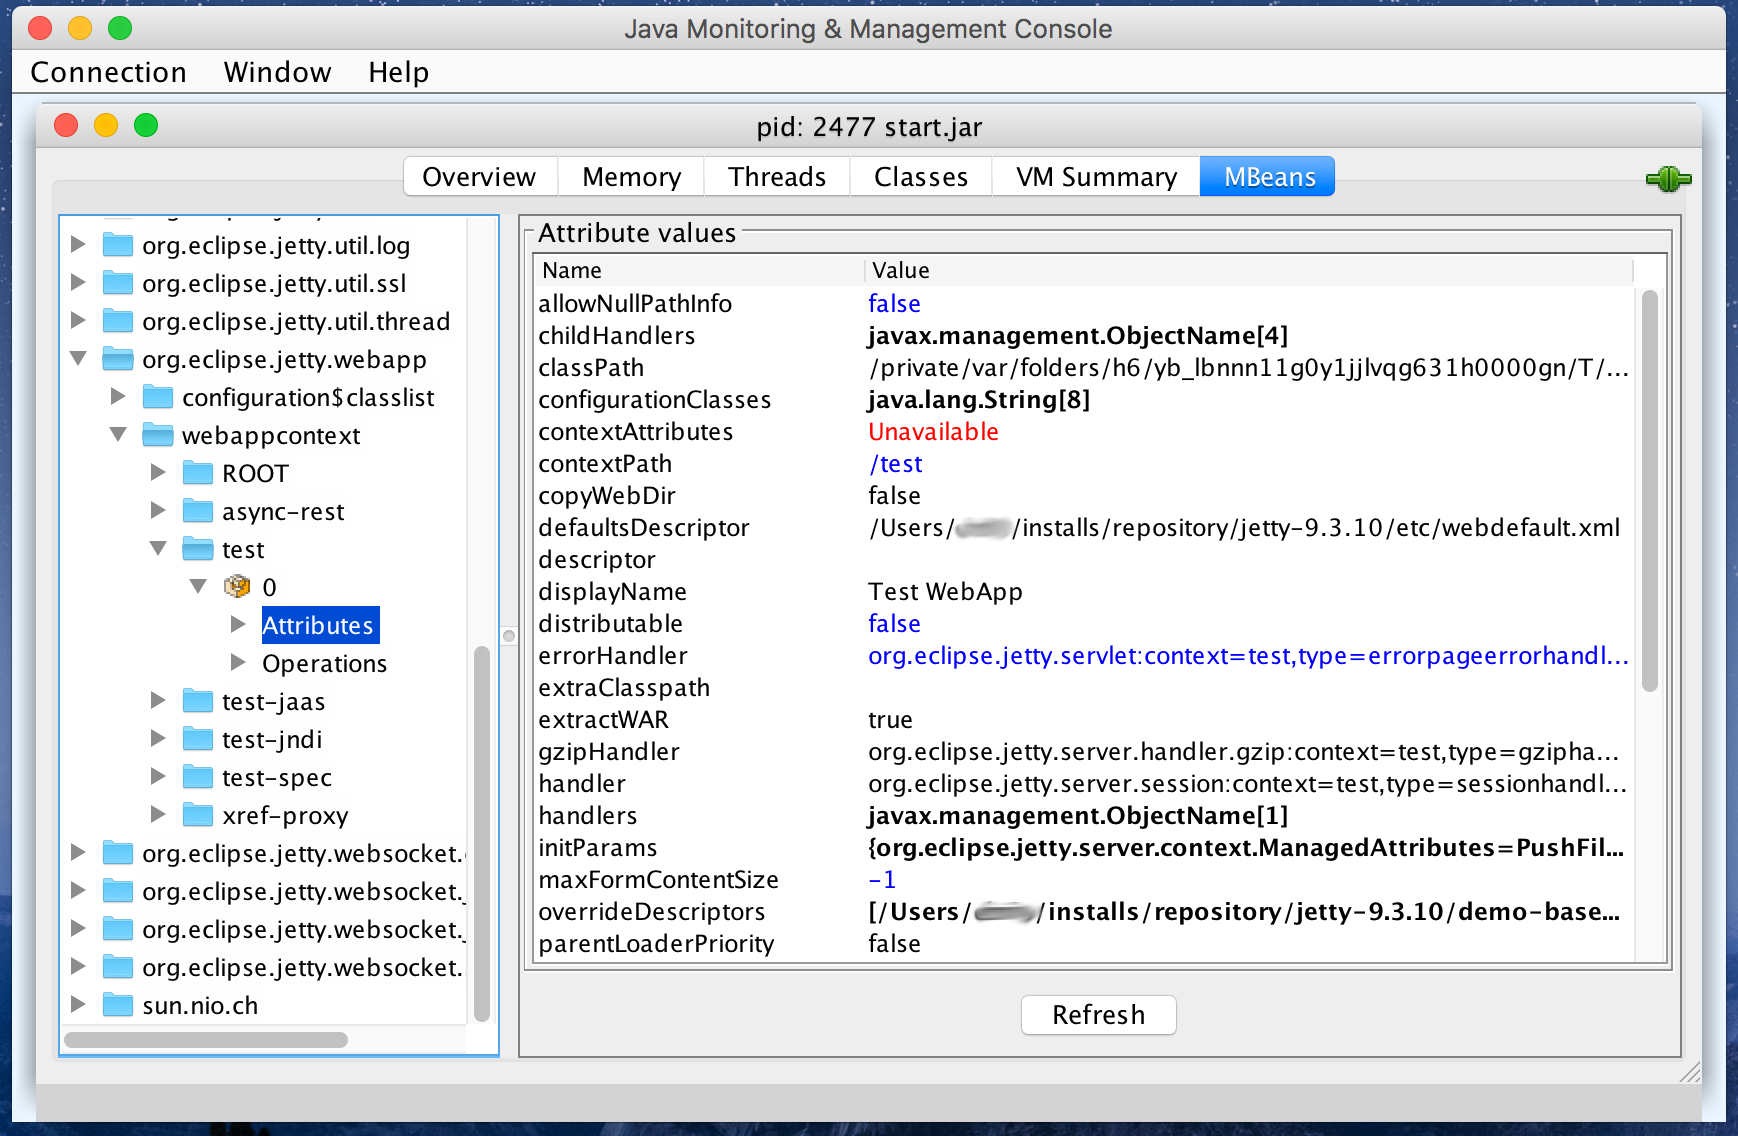
The MBean tab of JConsole allows access to managed objects within the Java application, including MBeans the JVM provides. If you also want to interact with the Jetty JMX implementation via JConsole, you need to start Jetty JMX in a form that JConsole can access. See Using JMX with Jetty for more information.
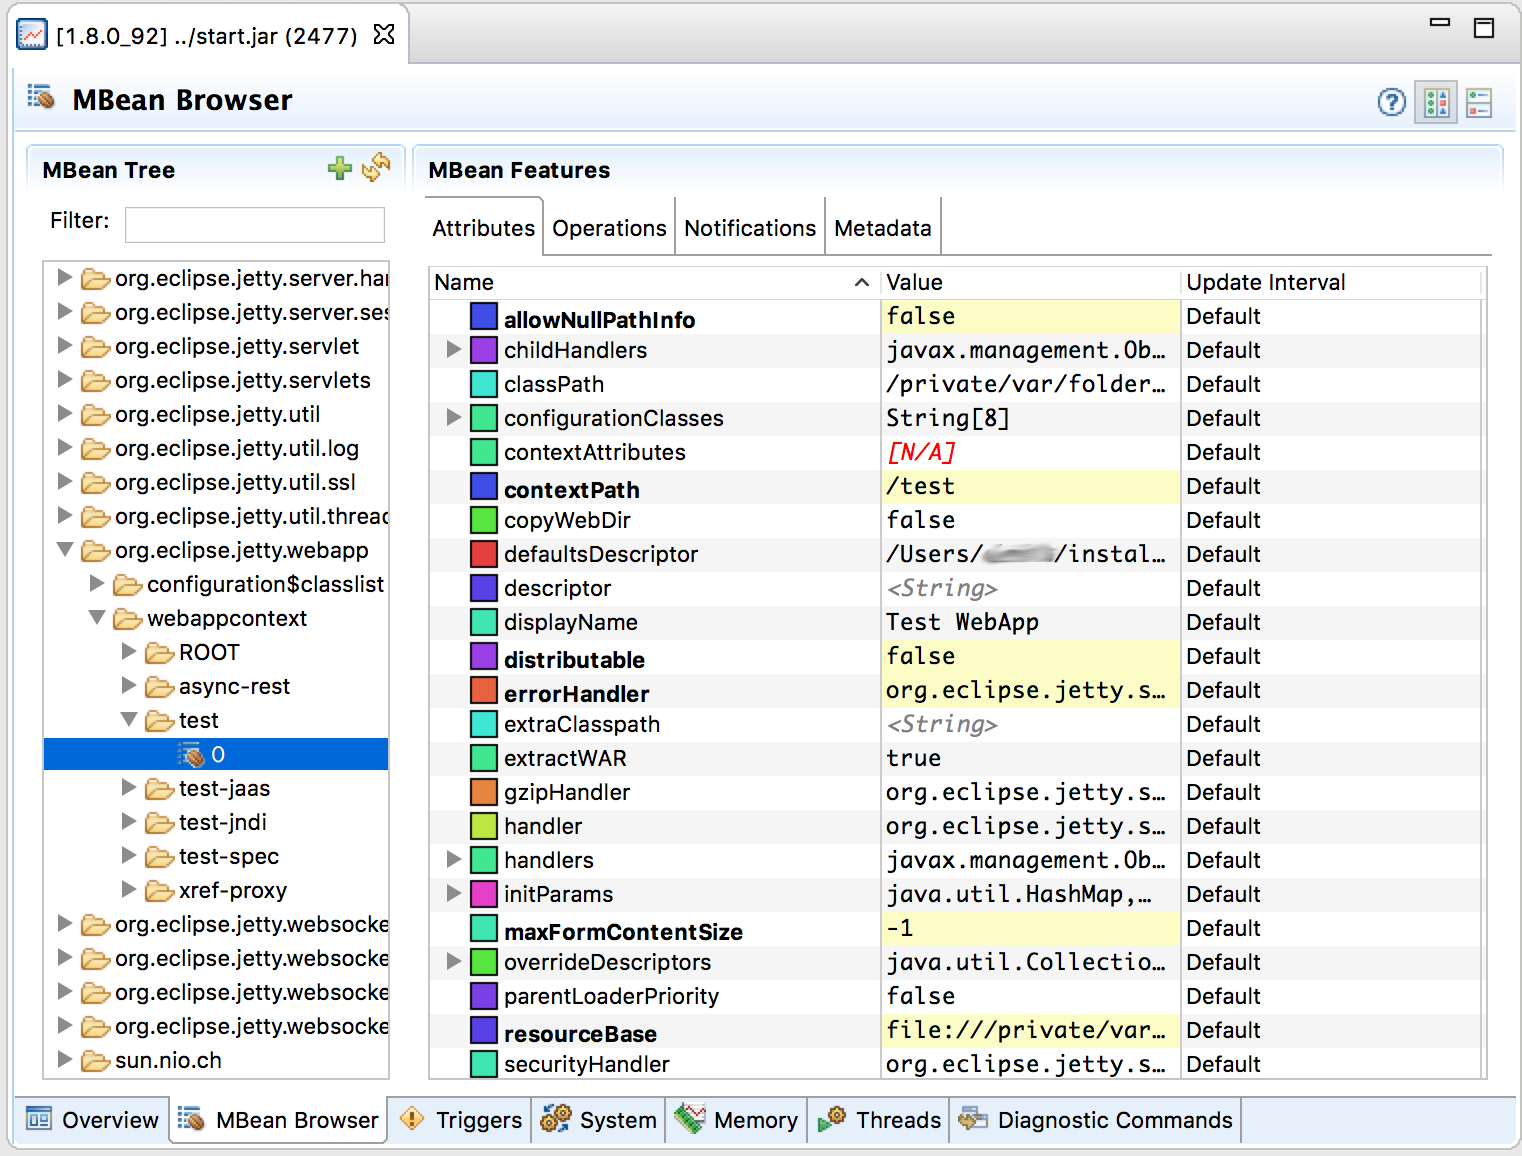
To monitor Jetty’s server status with JMC, start Jetty and then start JMC by typing jmc on the command line.
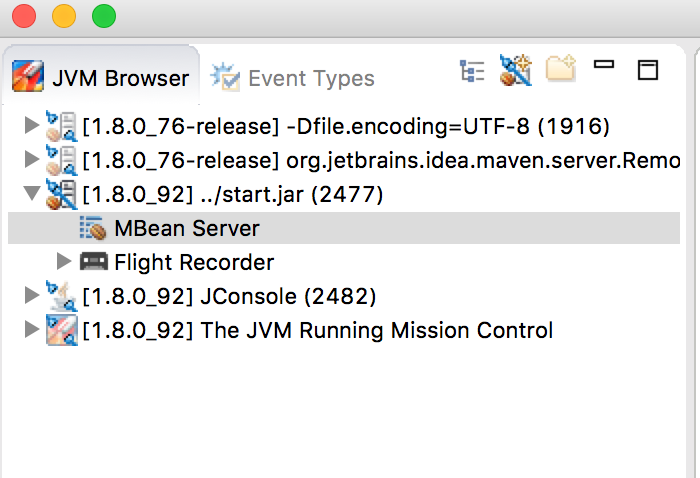
After you start Jetty, you will see a dialog box in JMC with a list of running processes to which you can connect. It should look something like so:
Important
If you don’t see your Jetty process in the list of processes you can connect to, quickly switch tabs, or close and reopen a new "New Connection" dialog window. This forces JMC to refresh the list, and recognize your newly-started Jetty process.
Double-click the start.jar entry or right-click the start.jar entry and select "Start JMX Console". A new JMC window opens on the right:
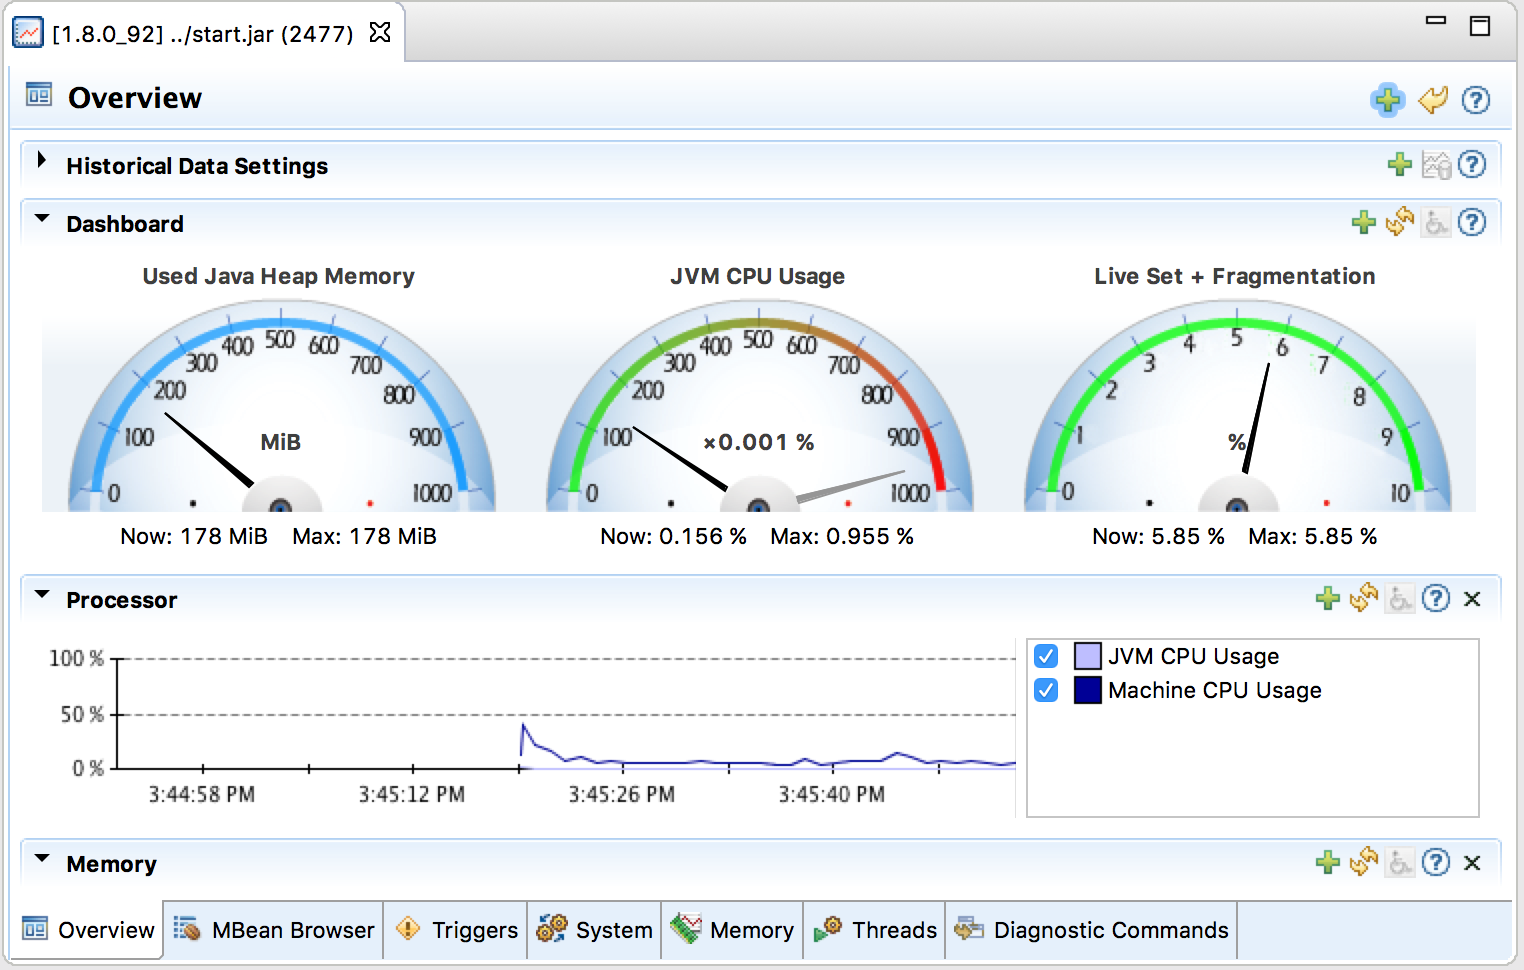
From this window you can monitor memory usage, thread usage, classloading and VM statistics. You can also perform operations such as a manual garbage collect. JMC is an extremely powerful and useful tool.
The MBean tab of JMC allows access to managed objects within the Java application, including MBeans the JVM provides. If you also want to interact with the Jetty JMX implementation via JMC, you need to start Jetty JMX in a form that JMC can access. See Using JMX with Jetty for more information.
